
QSR Data Challenge
Thermal Video Segmentation and Diagnosis in Laser-Based Metal Additive Manufacturing
Introduction:
Laser-Based Metal Additive Manufacturing (LBMAM) is an important 3D-printing technology. In LBMAM, metal powders are distributed onto a substrate plate; then a laser beam will heat the metal powders, which are molten and then consolidated into a layer. By stacking layers additively, LBMAM can print complicated objects.
In LBMAM, the laser heating process results in spatter patterns. Many factors, including heterogeneities in metal powder distribution, isotropy in heat conductance, and irregular laser beam movement, can affect the spatter pattern. To better understand the LBMAM process, thermal cameras can be used to capture video footage of the printing process. Analyzing the thermal video and the spatter patterns of the LBMAM can help to understand the process better and evaluate the quality of printed layers.
A frame of thermal video is shown below. In general, the pattern in the thermal video consists of one large region of the melt pool and several spatters. As the laser beam moves in one layer, the melt pool and spatters move accordingly.
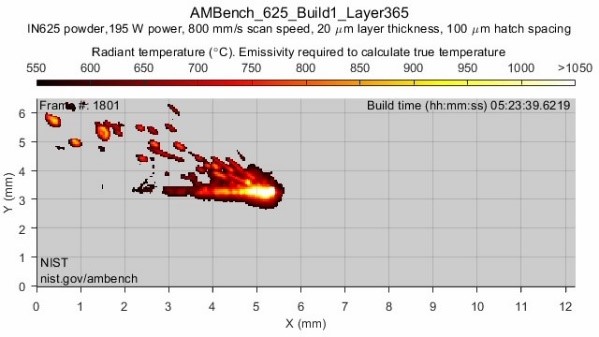
The overarching objective of this data challenge is to identify spatter patterns in the thermal video and provide insights into the shared and distinguished features of these patterns across time, geometry, and layers. By understanding the descriptive statistics of the melt pool and spatter patterns, one can then design targeted anomaly detection schemes.
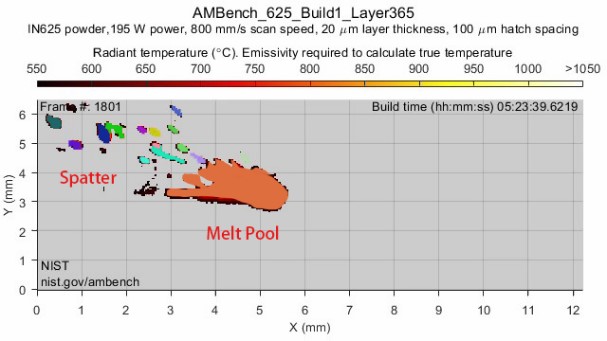
Below we provide an example that separates spatters and the melt pool.
Data
Data comes from the 2018 additive manufacturing (AM) Benchmark Test Series from the National Institute of Standards and Technology (NIST) aimed to encourage additive manufacturing practitioners to develop novel mitigation strategies for challenging build scenarios.
The dataset contains In-situ thermal measurement videos and MATLAB data structures from manufacturing eight metal parts using a commercial powder bed fusion machine. The thermal measurements were taken at a select region and were acquired at 1800 frames per second. The frames are acquired across multiple hundreds of layers. The dataset also contains information about camera timing, calibration, and process information.
For a detailed description, please see the data source below.
Link to Dataset: https://catalog.data.gov/dataset/in-situ-thermography-of-the-metal-bridge-structures-fabricated-for-the-2018-additive-manuf-275ac
Task
Through this dataset, tasks of interest include but are not limited to:
- Develop automatic video segmentation tools that find the spatter regions and identify their boundaries for a specific thermal frame. Based on the identified boundaries, estimate the average size and temperature of spatter regions.
- Model and describe the evolution in location and temperature of spatter patterns with time. Here understanding the correlation decay and predictive power of future patterns can be a valuable input to a time-series predictive model or a change-point detection model when transitioning between layers.
- Answering the question: What is shared and what is unique in both melt pool and spatter patterns across time and layers? Here extraction of unique and shared features can serve to develop targeted anomaly detection schemes. Despite the dataset not having any labels as to whether a frame is anomalous or not, you may heuristically define an anomaly – perhaps highly dispersed spatter patterns. The labels can then be used to validate anomaly detection schemes using the extracted features.
We also note that other novel and innovative contributions and approaches towards gaining insights from this dataset are also encouraged.
Submission Details
A team of up to seven members may participate in this challenge. The submission deadline is May 25, 2023. The submission should consist of a report along with the source code used to generate figures and tables in the report. The report should be limited to 25 pages, excluding references. It should clearly highlight your tested hypothesis, methodology, assumptions, preprocessing steps, and implementation details. Participants can use any coding language to solve the problem.
Submission will be evaluated by a panel of 3 judges based on (i) the suitability and innovation of the used methodology, (ii) the insights derived from the model, and (iii) the clarity, technical correctness and completeness of the report and the presentation. Finalists will present their solutions live at the ICQSR conference. The first place and runner-up of the competition will be then announced and recognized at the conference.
The three competition judges are Dr. Raed Al Kontar from the University of Michigan (UM) – Ann Arbor, Dr. Abdallah Chehade from the University of Michigan (UM) – Dearborn, and Dr. Simon Mak from Duke University.
All submissions should contain a single zip file named “ICQSR_Data_Teamname.zip” and be emailed to the organizers Raed Al Kontar alkontar@umich.edu and Naichen Shi naichens@umich.edu by 11:00 pm EST on May 25, anywhere on earth.